
Power BI

Get a clear, detailed, and subtle picture of high-volume data critical for your business growth with RRR CLOUD SOLUTIONS’s Data visualization services. Partner with us to transform your enterprise into a data-led business with interactive dashboards to turn your data into the most consumable format possible. We enable you to shape your next business move by employing your data to provide actionable insights. Redefine your business growth by visualizing and analyzing the data more finely.
Make the most of your data silos by unlocking different ways of data visualization and analysis to achieve your business goals. our extensive data visualization consulting services enable us to convert raw data into comprehensible formats regardless of data type. Declutter huge volumes of data for better monitoring, prediction, and opportunity realization to enhance the decision-making process.

Centralize and transform your data storage for better data collection, analysis, and sharing with our business intelligence app development services. Our BI app development specialists offer data visualization consulting for interactive app development solutions and strategies to drive improved business decisions to maximize ROI through advanced analytics features which enable real-time monitoring of your data analytics metrics.
From C-suite managers, mid-level management, and data experts to varied users, we offer paginated reports and intuitive dashboards with custom elements like graphs, charts, maps, and more to ease specialized data analytics requirements. We at RRR CLOUD SOLUTIONS specialize in data visualization as a service providing personalized tactical, strategic, leadership, operational, and analytics dashboards along with the ability to integrate them with your existing systems or software.
Ease your specific data visualization and analytics need with our personalized data visualization strategy and implementation of data visualization solutions. Our data visualization consultant would research, analyze, and implements efficient data visualization techniques which are best fit for your requirements to unlock masked opportunities and unlock new business growth perspectives.
Accord your business the power of data analytics with strategically crafted custom dashboards aligning with the specific analytics requirements. Avail RRR CLOUD SOLUTIONS’s data visualization service to leverage fully customized data visualization solutions for your specific KPIs and data from various sources. Our dashboards are designed to provide consumable data formats for a range of users from experts to novices.
The hefty volume of data and information from various sources channeled into dashboards can be chaotic for analysis. With RRR CLOUD SOLUTIONS’s data visualization consulting services, our data visualization consultant ensure that your dashboards meet your specific expectations by optimizing visualizations for improving access, interactions to reduce the load time, optimizing database for querying, and seamless rending of data insights on various devices.

Not only interpreting data in natural language but also real-time analysis of high-volume data, our data visualization consultant leverage AWS, Azure, Google Cloud, and more for channelizing the data silos into the dashboard from various cloud sources. We make facilitate the business to integrate high-volume data from various courses in the cloud into a single custom dashboard to drive the ease of decision-making for businesses.

Simplify the colossal task of migrating your huge volume of data from legacy to a modern BI platform or data visualization solutions like Power BI, Tableau, etc with our BI migration service. Our BI experts also facilitate migration from one BI/ ETL tool to another or upgrading to the new various BI/ ETL tools. With our data visualization service, you can connect with our experts who ensure high performance, minimal downtime, and accurate migration.

Make your existing data platform future ready with innovative methods to modernize it. Our data visualization development experts can build you a custom data platform that supports analytics and BI. We employ ETL and OLAP to integrate the data from various sources with the data platforms. Visualize your data with our data platform development service to back your decision-making with actionable insights.

Power BI

Tableau
Pentaho

SSRS

Excel

Logi Composer

ADF

PDI

AWS Glue

Hevo

SSIS

SQL Server
Azure Synapse

Redshift

MySQL

Snowflake

PostgreSQL
Projects Delivered
Enterprise Client Retention
Happy Clients
Counties Served
Clients of 2+ years
Customer Ratings
Unlock silos of information to drive transformation for your business with improved decision-making powers. These data visualization services help businesses irrespective of niches to better organize data for better breakdown and understanding of data.
Eliminate the requirement of dozens of frustrating spreadsheets for data tracking and reporting for your business. Make data decoding easier with better visual representation using advanced data visualizations of real-time data to help foresee business opportunities.
Unclose the previously invisible patterns to formulate valuable insights, recognize relationships and give greater meaning to the data silos with data visualization strategies. The tables, charts, maps, graphs, and more enables the user to easily digest huge volumes of data.
Uncover the crucial components or details of the data coming from various sources by the users or departments of your organization through dedicated dashboards. Our data visualization consulting enables the users to have a different perspective of the data by channeling it.
Reports are a crucial aspect of any organization and maintain the pace of productivity consistently in every department. The customized reports allow the C-suite manager and experts to track the KPIs effectively and realize the factors affecting productivity or business growth.
Escalate business profits by recognizing the market shifts for the benefit of the business. Data visualization enables to leverage the of emerging trends by taking a closer look at the fluctuating patterns of data in dashboards and hence eliminating the consequences of a failed strategy.
To rectify mistakes, identifying erroneous data is crucial. Our data visualization service enables the business to have a clear picture of data silos. The enhanced interactive data visuals help to eliminate erroneous data from the following data sets.

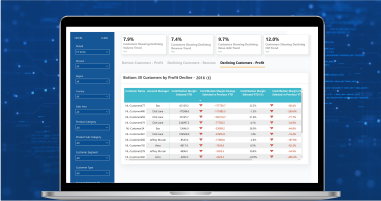
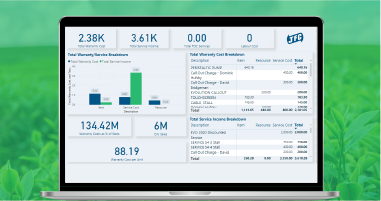
Our Power BI services empower businesses to make informed decisions and be more data-driven through intuitive, customized dashboards and reports using Power BI.
Explore MoreRebuild your data strategy with the Tableau platform to increase efficiency, boost productivity, and maximize profitability. Our Tableau analytics, consulting, and visualization services help you gain deeper insights to solve complex business challenges. Tableau is leading visual analytics, business intelligence, and data visualization platform helping businesses to drive change with data with powerful and smart insights.
Explore MoreHire dedicated development team from RRR CLOUD SOLUTIONS that works as your in-house IT team to deliver high-quality, secure, scalable, and reliable software solutions.
Explore MoreRRR CLOUD SOLUTIONS’s BI team creates a tailored data warehouse solution considering your unique requirements for data storage, integration, governance, management, and collection. On-premise or clouds, our data warehousing services encompass cleaning, formatting, and preparing data for data analytics. RRR CLOUD SOLUTIONS understands the importance of data warehouse in place to increase the speed of data assessment, improve analytics, and compete more strategically.
Explore MoreRRR CLOUD SOLUTIONS’s data analytics services can help organizations of any size and every industry to transform their businesses by tapping into the power of data analytics.
Explore MorePentaho data integration and analytics help businesses supercharge their operations, manage data, and enable real-time data analytics to foster a data-driven culture.
Explore More


